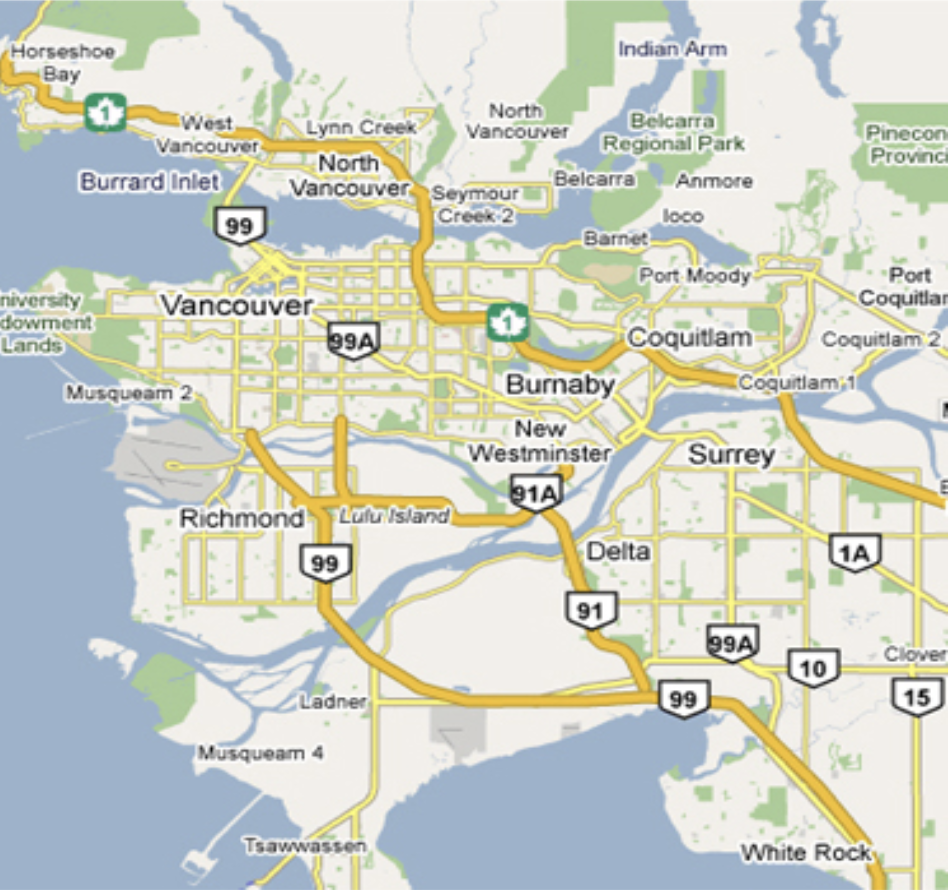
You’ve got 9 errands to run. What order do you do them in?
Determine the least cost route through a set of given locations, returning to the start.
Travelling Salesperson Problem (TSP)
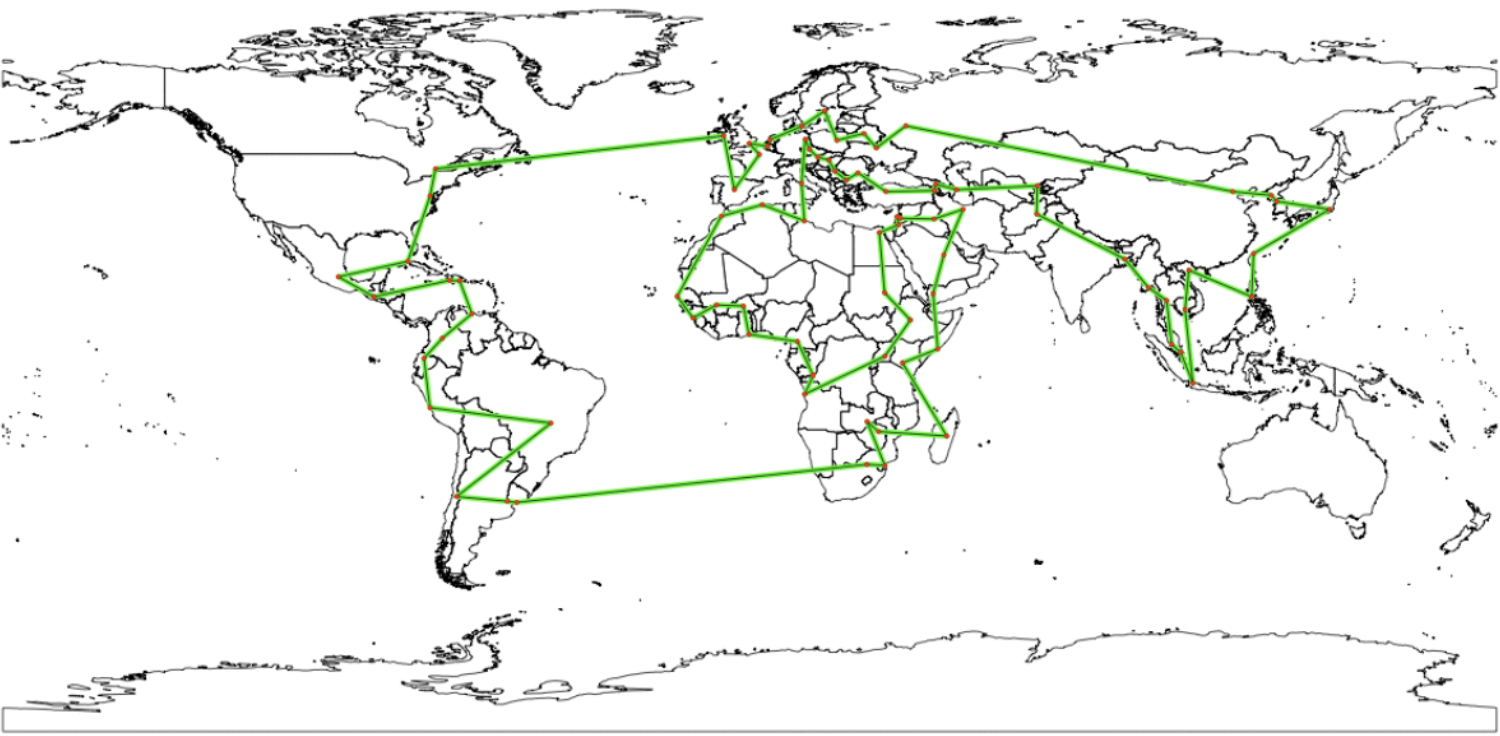
“Given a list of cities, and the distances between each pair of cities, what is the shortest possible route that visits each city exactly once and returns to the origin city?”
Classic problem on graphs
First known mention was in 1930
________________________________________
Why is the problem so hard?
Suppose you have 6 locations. How many different candidate solutions are there? Generalize to k locations?
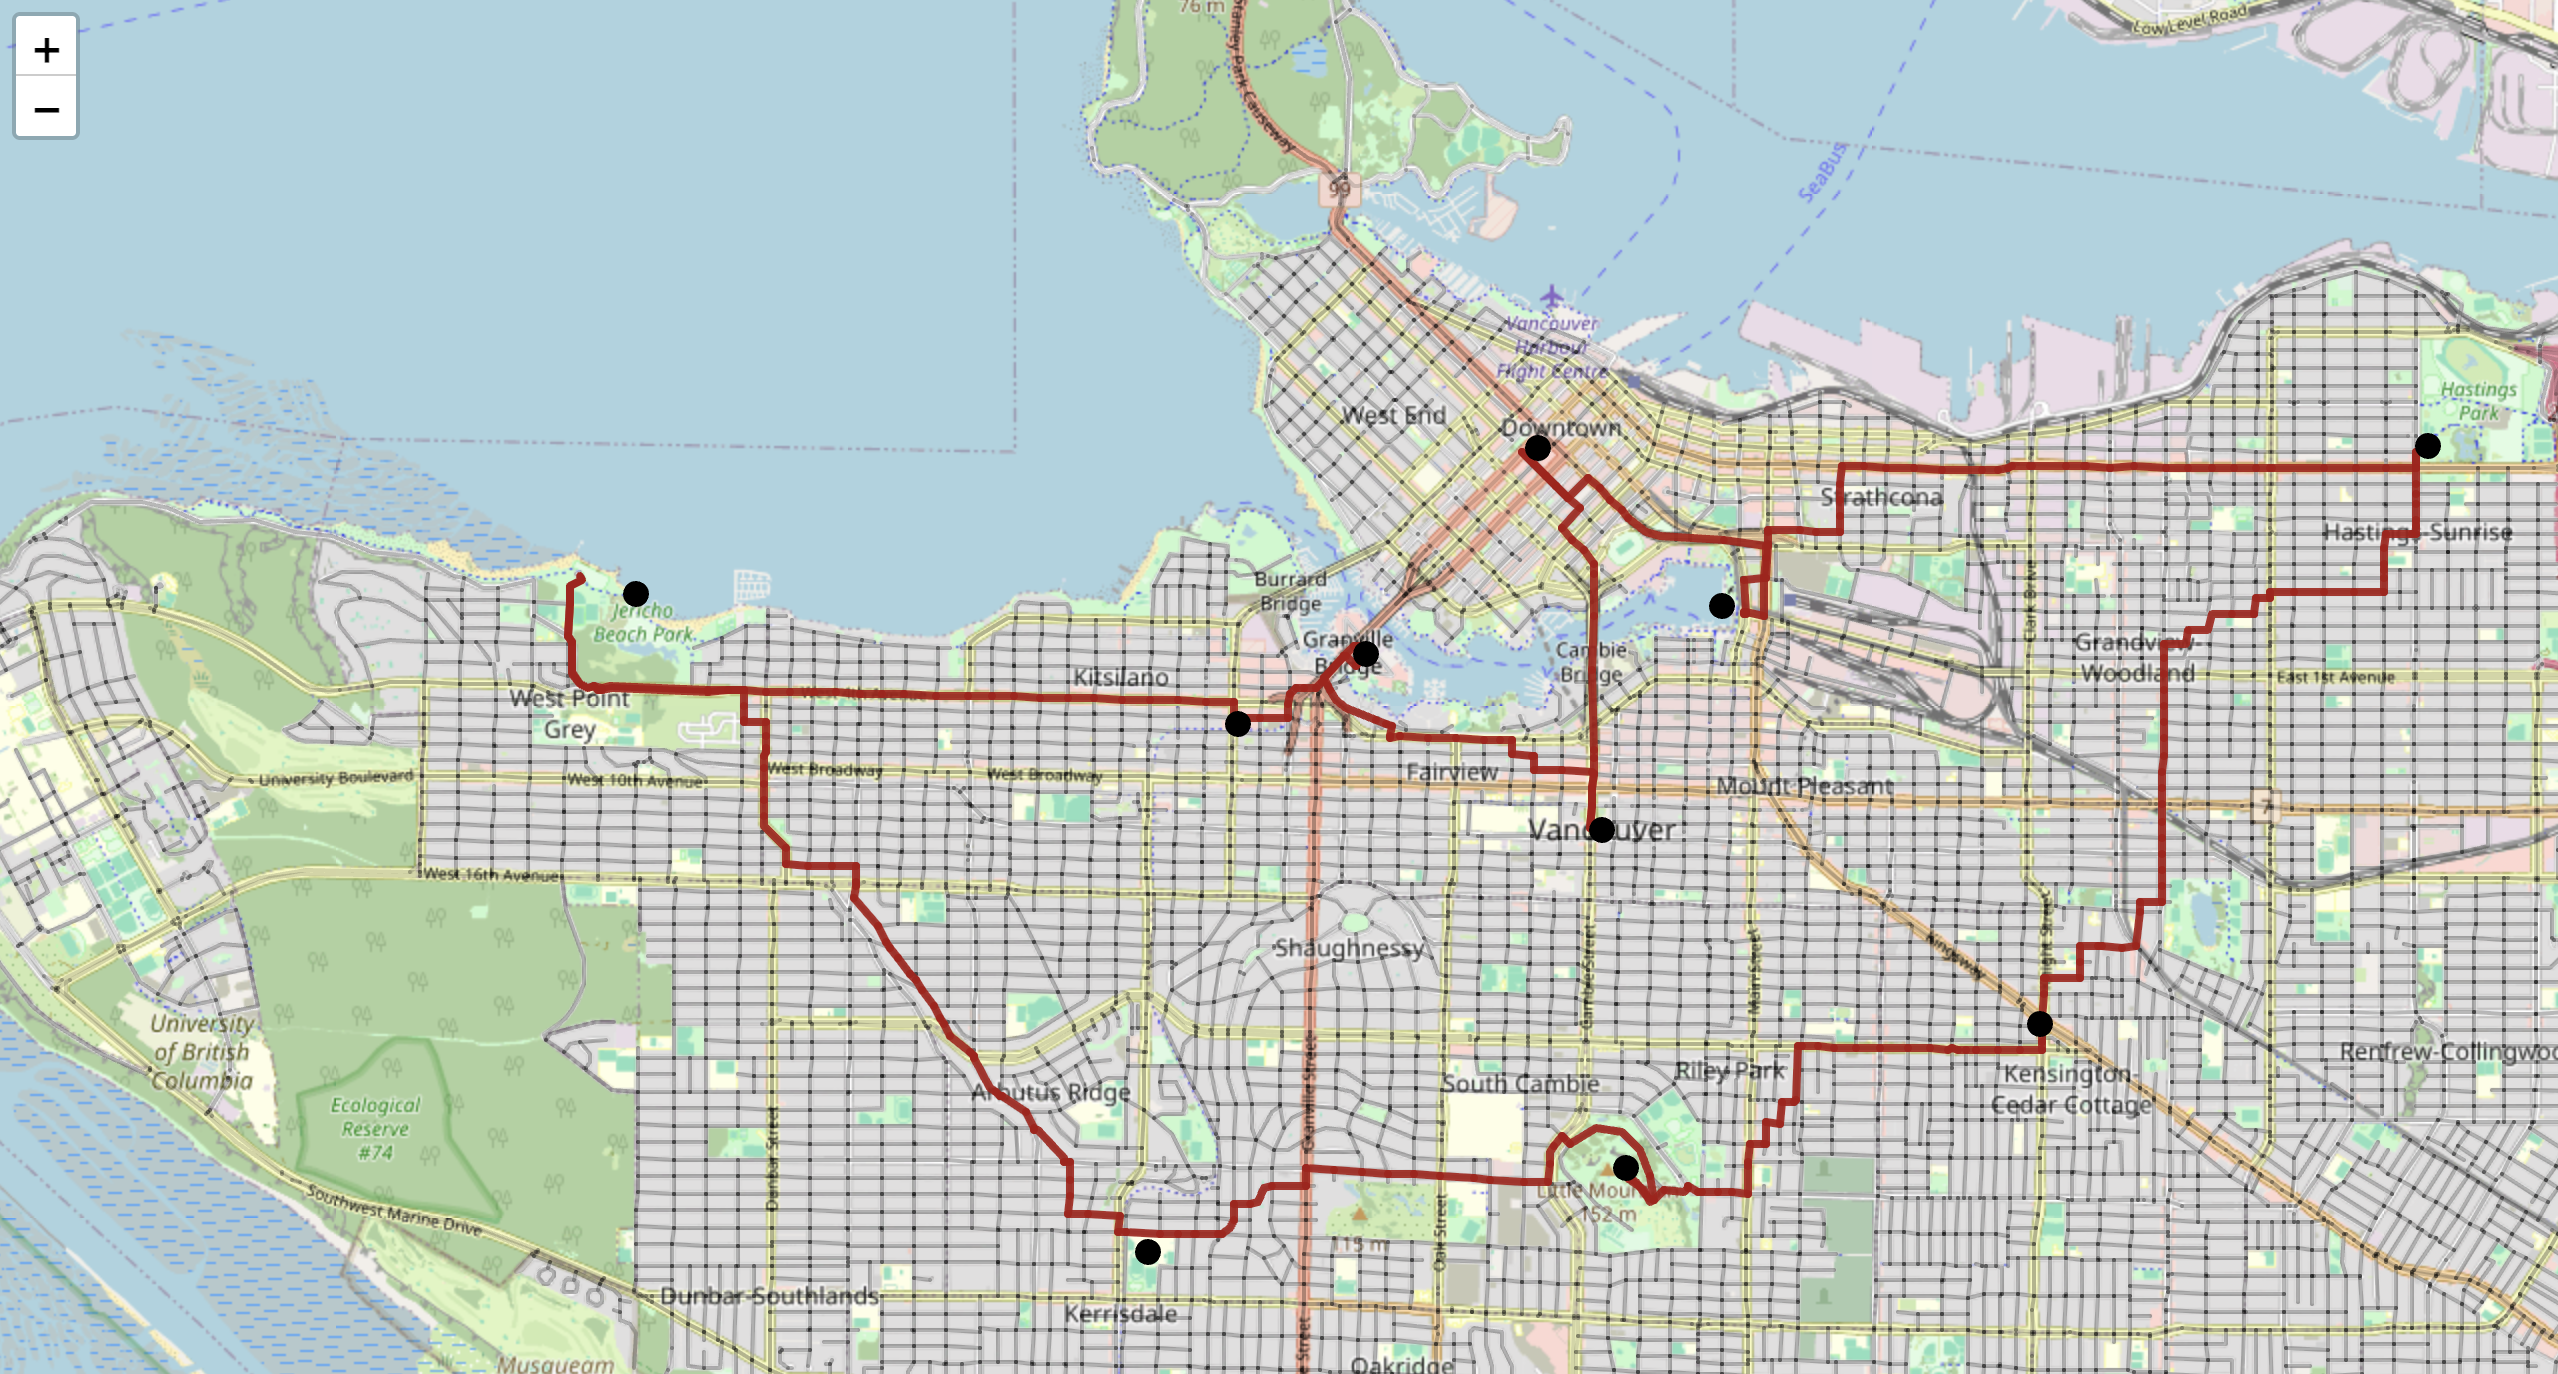
Goal: Create a new column (latlong) and fill it with coordinates for each errand in the dataframe.
How it works:
df.apply(..., axis=1): Run a function once for each row.
lambda row: ox.geocode(row['errand']): A tiny inline function. Read it as: “Given a row, look up the place name in row['errand'],geocode it, and return the (lat, lon).”
The returned value becomes the entry in the new latlong column.
Why lambda? We only need this function once, so we write it right where it’s used.