Programming, problem solving, and algorithms
CPSC 203, 2025 W1
November 20, 2025
Announcements
Single Source Shortest Path, Fin
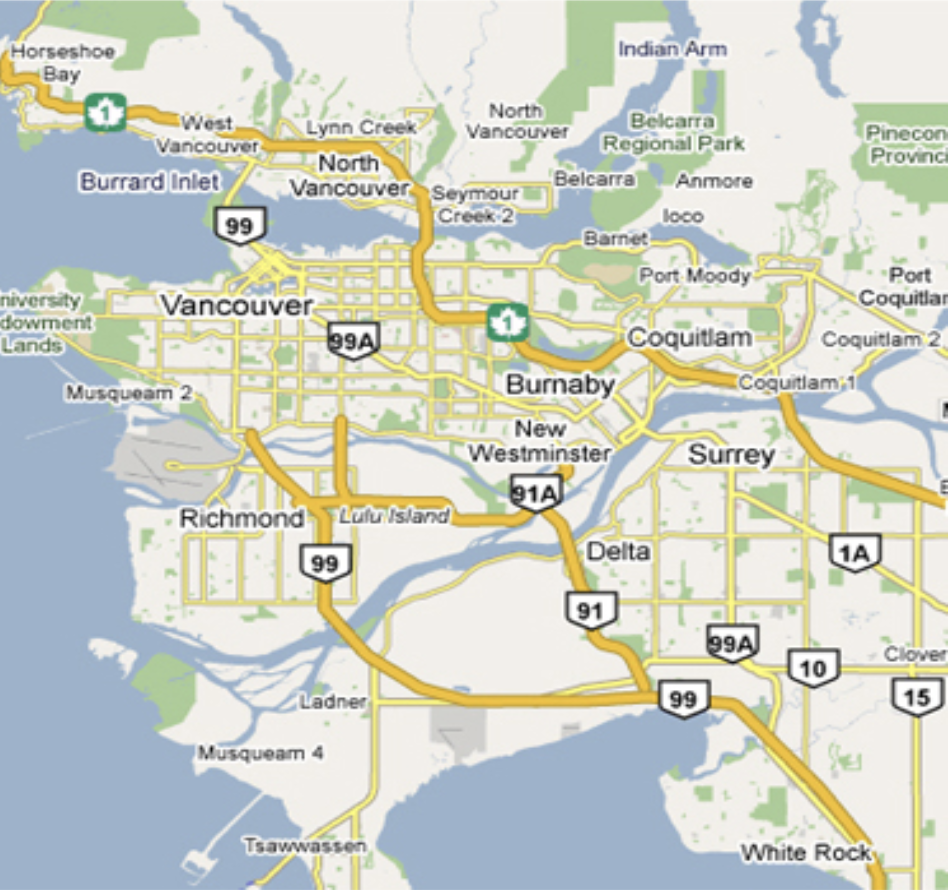
Geographic Applications
The data we use for computation is separate from the visualization.
Dijkstra’s Algorithm
Initialize structure:
- For all
v,d[v] = INF,p[v] = null
- For all
Initialize source:
d[s] = 0Repeat these steps
ntimes:
- Find minimum
d[]unlabelled vertex:v - Label vertex
v - For all unlabelled neighbors
wofv,- If (_________________ <
d[w])d[w] =______________p[w] = v
- If (_________________ <
- How is the algorithm similar to BFS/DFS?
____________________________________ ____________________________________ ____________________________________
- How is the algorithm different from BFS/DFS?
____________________________________ ____________________________________ ____________________________________
Final Demo
What We’ll See in the Demos
Convert map data to graph
Identify amenities (Starbucks)
Compute shortest route between two landmarks
Visualize everything interactively
What have we Learned?
| Algorithm | Data Structure | Costs? | Shortest? | Frontier |
|---|---|---|---|---|
| DFS | Stack | ignored | no | dive deep |
| BFS | Queue | all equal | yes | explore in layers |
| Dijkstra | Priority Queue | any non-neg | yes | explore by shortest known distance |
Resources
REALLY great example: https://www.youtube.com/watch?v=wsSEKm-rU6U
OSMNX reference: https://github.com/gboeing/osmnx-examples
Tutorial: https://gist.github.com/psychemedia/b49c49da365666ba9199d2e27d002d07
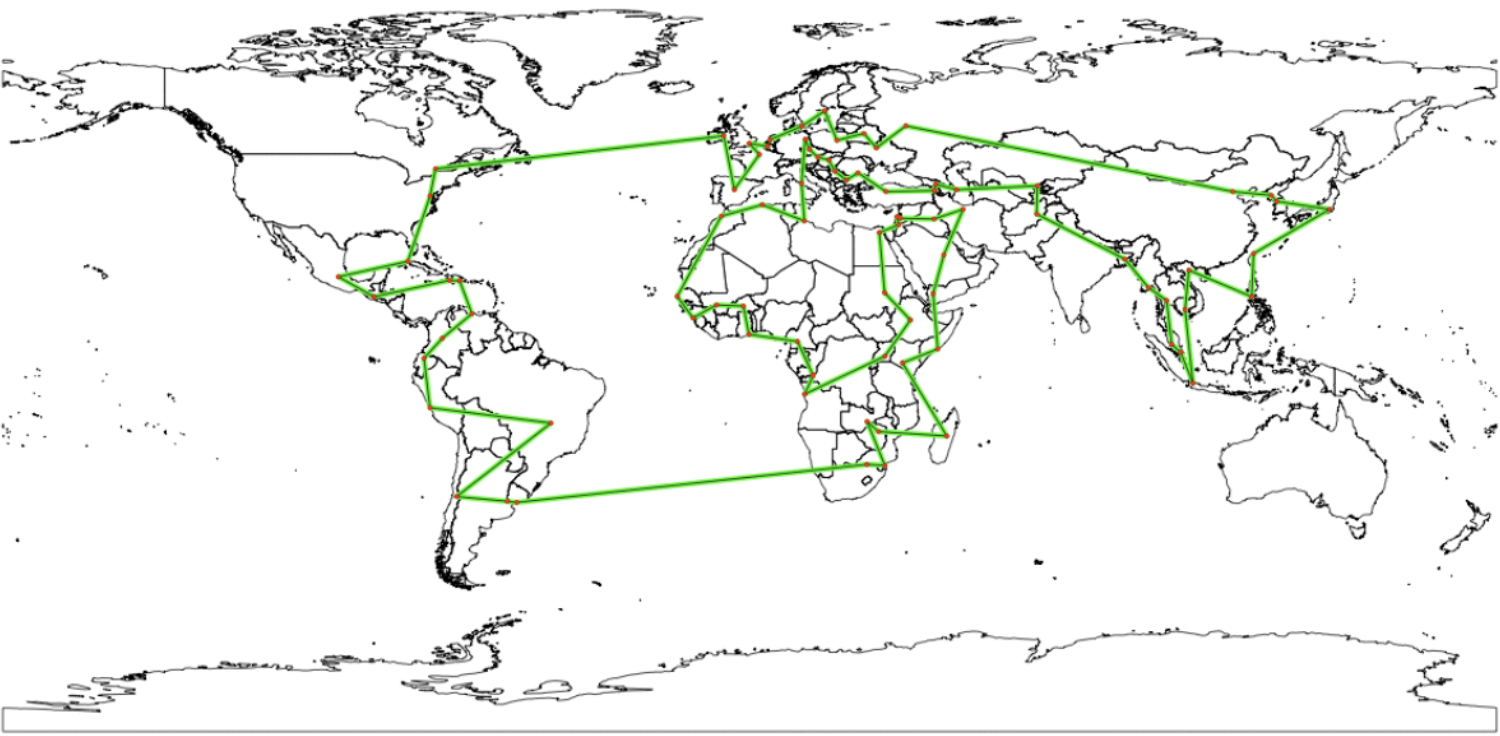
Travelling Salesperson Problem (TSP)
Maps: Running Errands
Determine the least cost route through a set of given locations, returning to the start.

Travelling Salesperson Problem (TSP)
“Given a list of cities, and the distances between each pair of cities, what is the shortest possible route that visits each city exactly once and returns to the origin city?”
Classic problem on graphs
First known mention was in 1930
________________________________________
How many routes?
Suppose you have 6 locations. How many different candidate solutions are there? Generalize to k locations?
________________________
________________________
________________________
________________________
________________________
Demo Blog
https://medium.com/data-science/around-the-world-in-90-414-kilometers-ce84c03b8552
Plan for Code
Steps to assemble our solution:
________________________________________
________________________________________
________________________________________
________________________________________
________________________________________
A Technical Detail
Demo
What Does lambda Do?
Goal: Create a new column (latlong) and fill it with coordinates for each errand in the dataframe.
How it works:
df.apply(..., axis=1): Run a function once for each row.lambda row: ox.geocode(row['errand']): A tiny inline function. Read it as: “Given a row, look up the place name inrow['errand'],geocode it, and return the (lat, lon).”The returned value becomes the entry in the new latlong column.
Why lambda? We only need this function once, so we write it right where it’s used.
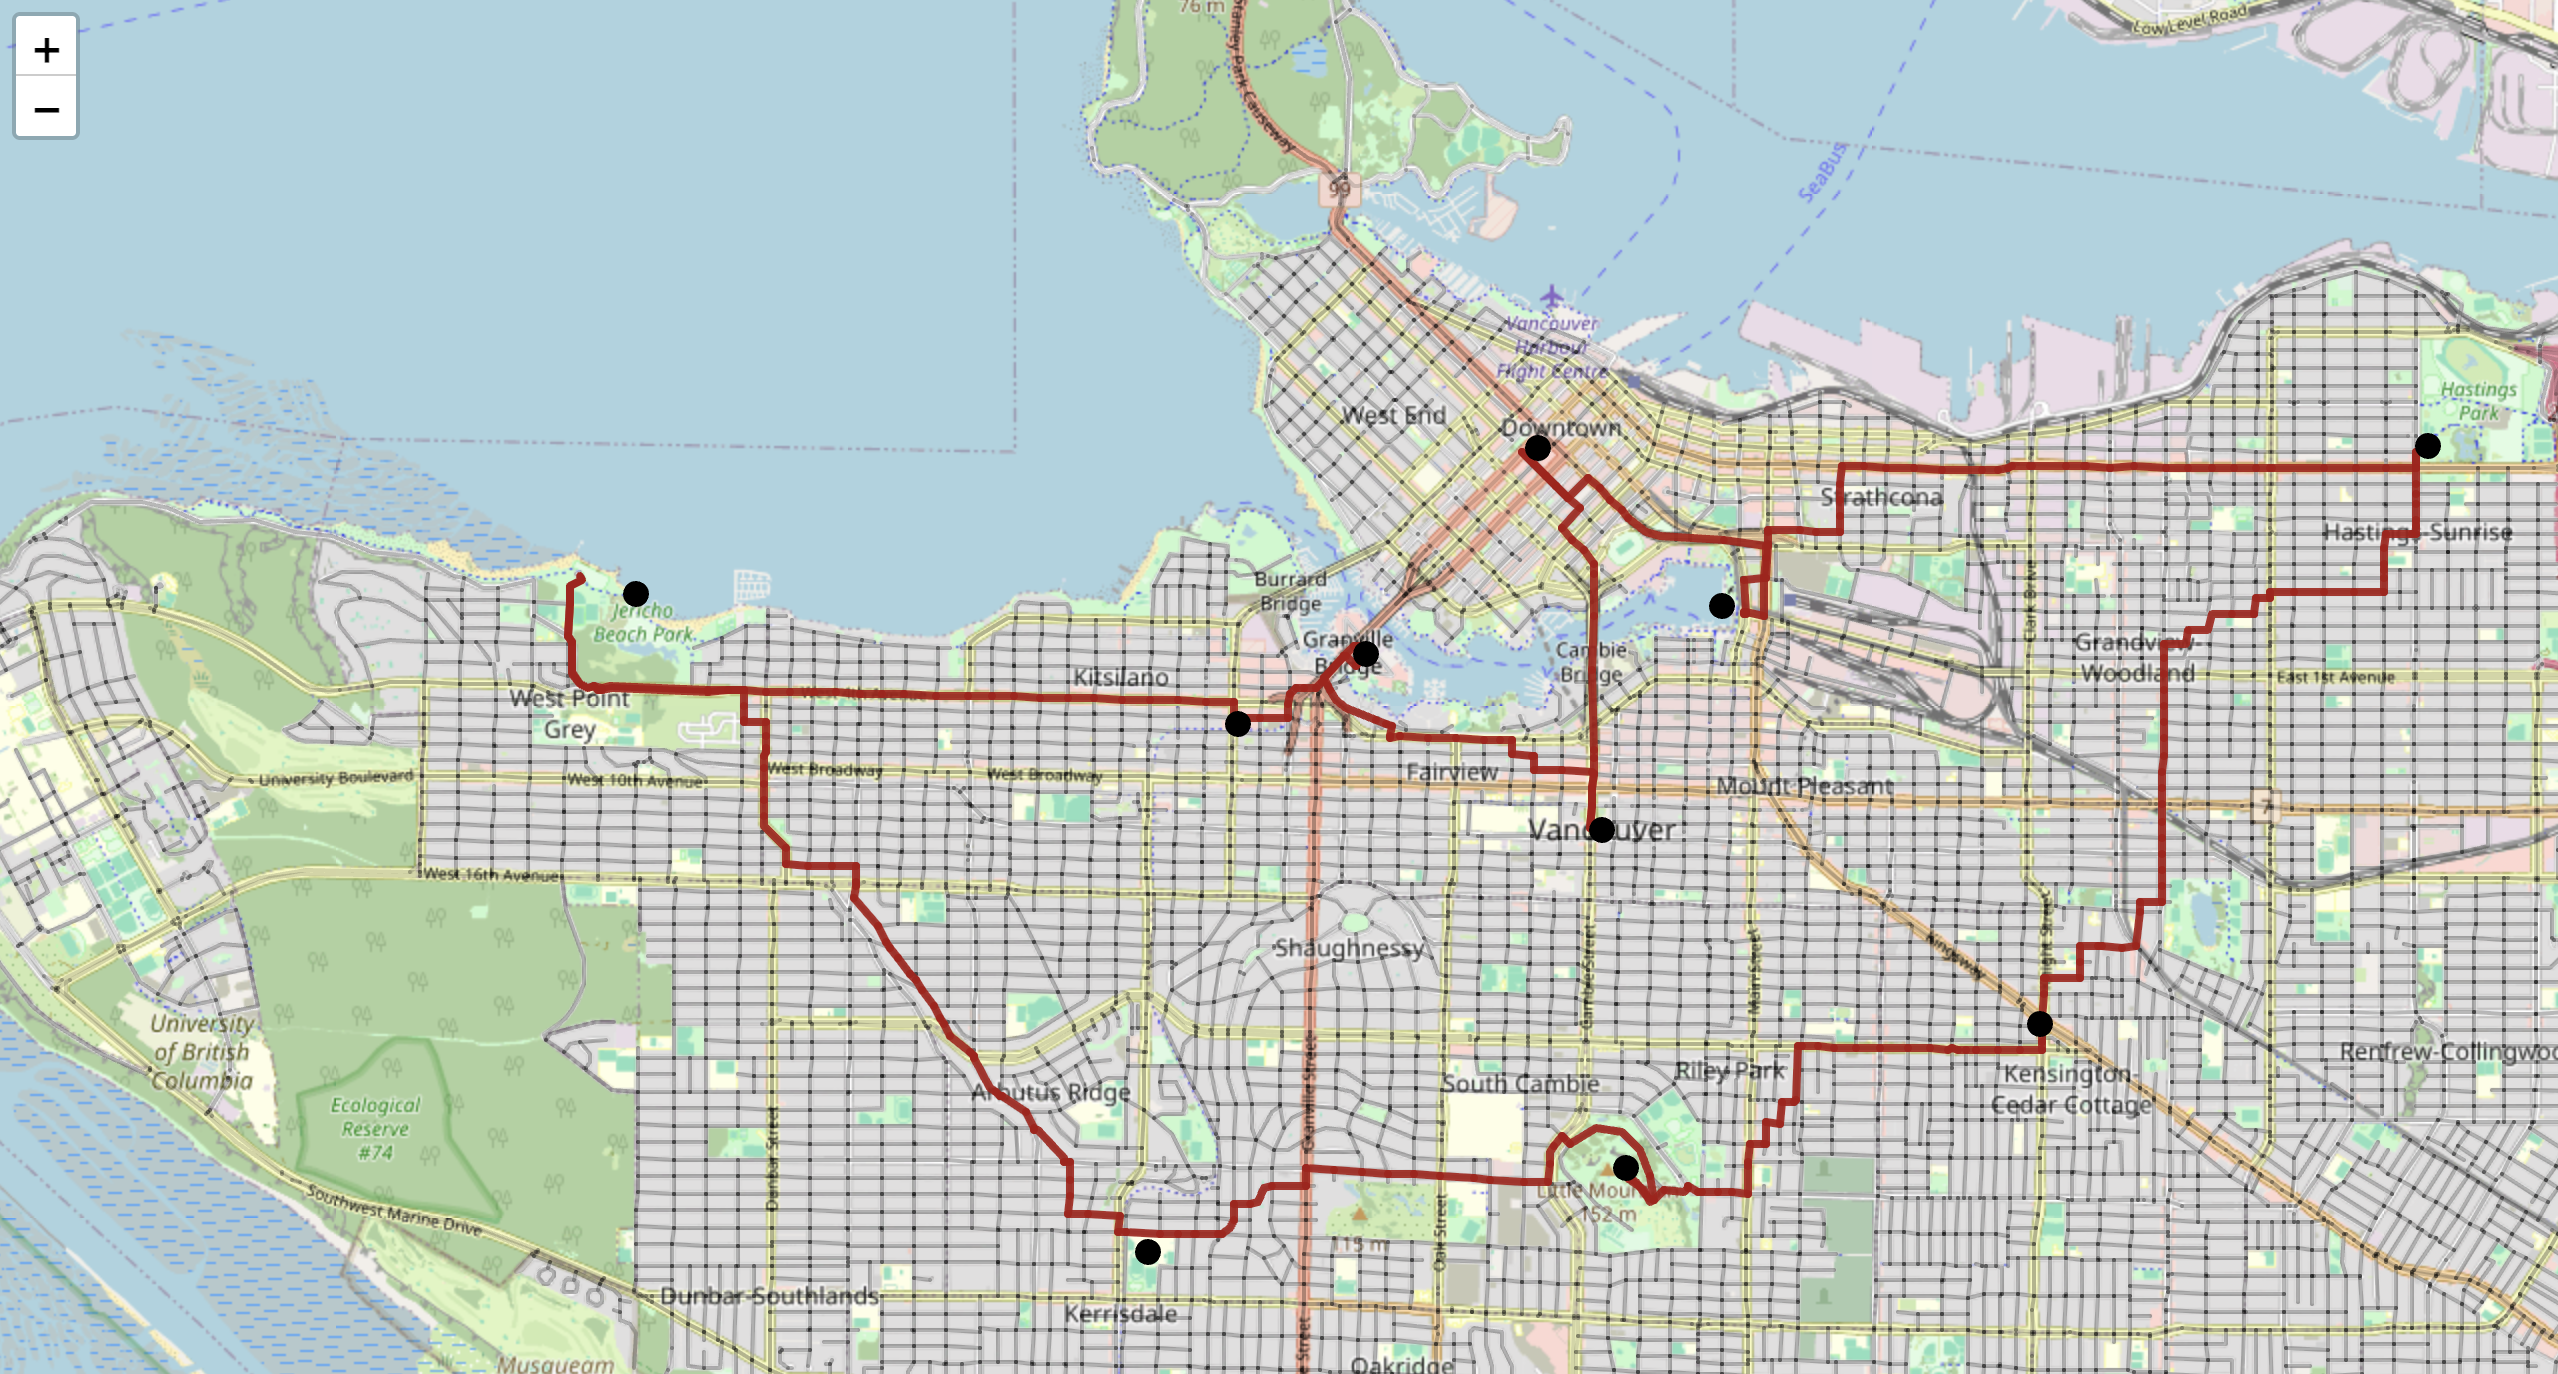
Tour Distance
We assemble each candidate solution as an arrangement of all of the errands:
Ex: A D B E F C
How do we find the total distance if we do the errands in the suggested order?
Why This Matters
There are lots of applications:
- 📦 UPS/FedEx/Amazon Delivery Millions saved by reducing even 1km per driver per day.
- 🍔 UberEats/DoorDash/Skip Multi-stop pickup/delivery with time windows.
- 🧬 DNA Sequencing & Genome Assembly Ordering fragments relies on TSP-like reconstruction.
- 🚌 School Bus Routing Minimize buses, fuel, and time while meeting constraints.
- 🧪 Medical Lab Sample Pipelines Robotic arms schedule efficient multi-station workflows.
- ❄️ Snowplow & Garbage Truck Routing Efficiently cover every street in a city.
- 🏭 Factory Robots & CNC Machines Optimizing tool paths reduces waste, heat, and wear.
- ✈️ Airline Crew Scheduling Complex daily routing: crews must return to base, meet rest rules.
- 🌍 City Infrastructure Planning Utility inspections, meter reading, streetlight repair routes.
- 🚑 Ambulance & Emergency Routing Minimize response times; life-critical optimization.