Voronoi Art
![]()
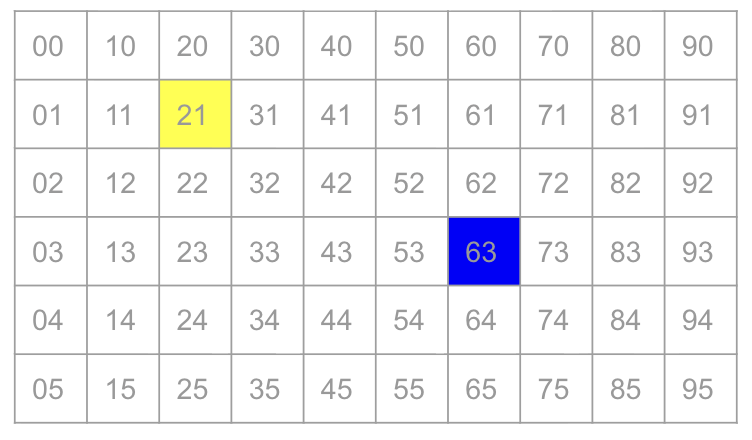
- enqueue and process the centers
- while the queue is not empty:
- v = dequeue
- for each valid neighbor w of v:
Analysis
How much work is done? Let \(n\) denote the size of the image, \(n = width \cdot height\)
Read image:
Choose centers:
Build new image:
- Write out new image:
Analysis Continued
We evaluate algorithms by looking at how their running times change as a function of the input size (n).
- Loosely, algorithm A is faster than algorithm B if A’s running time is eventually less than B’s.
Summary!
Our Voronoi journey taught us:
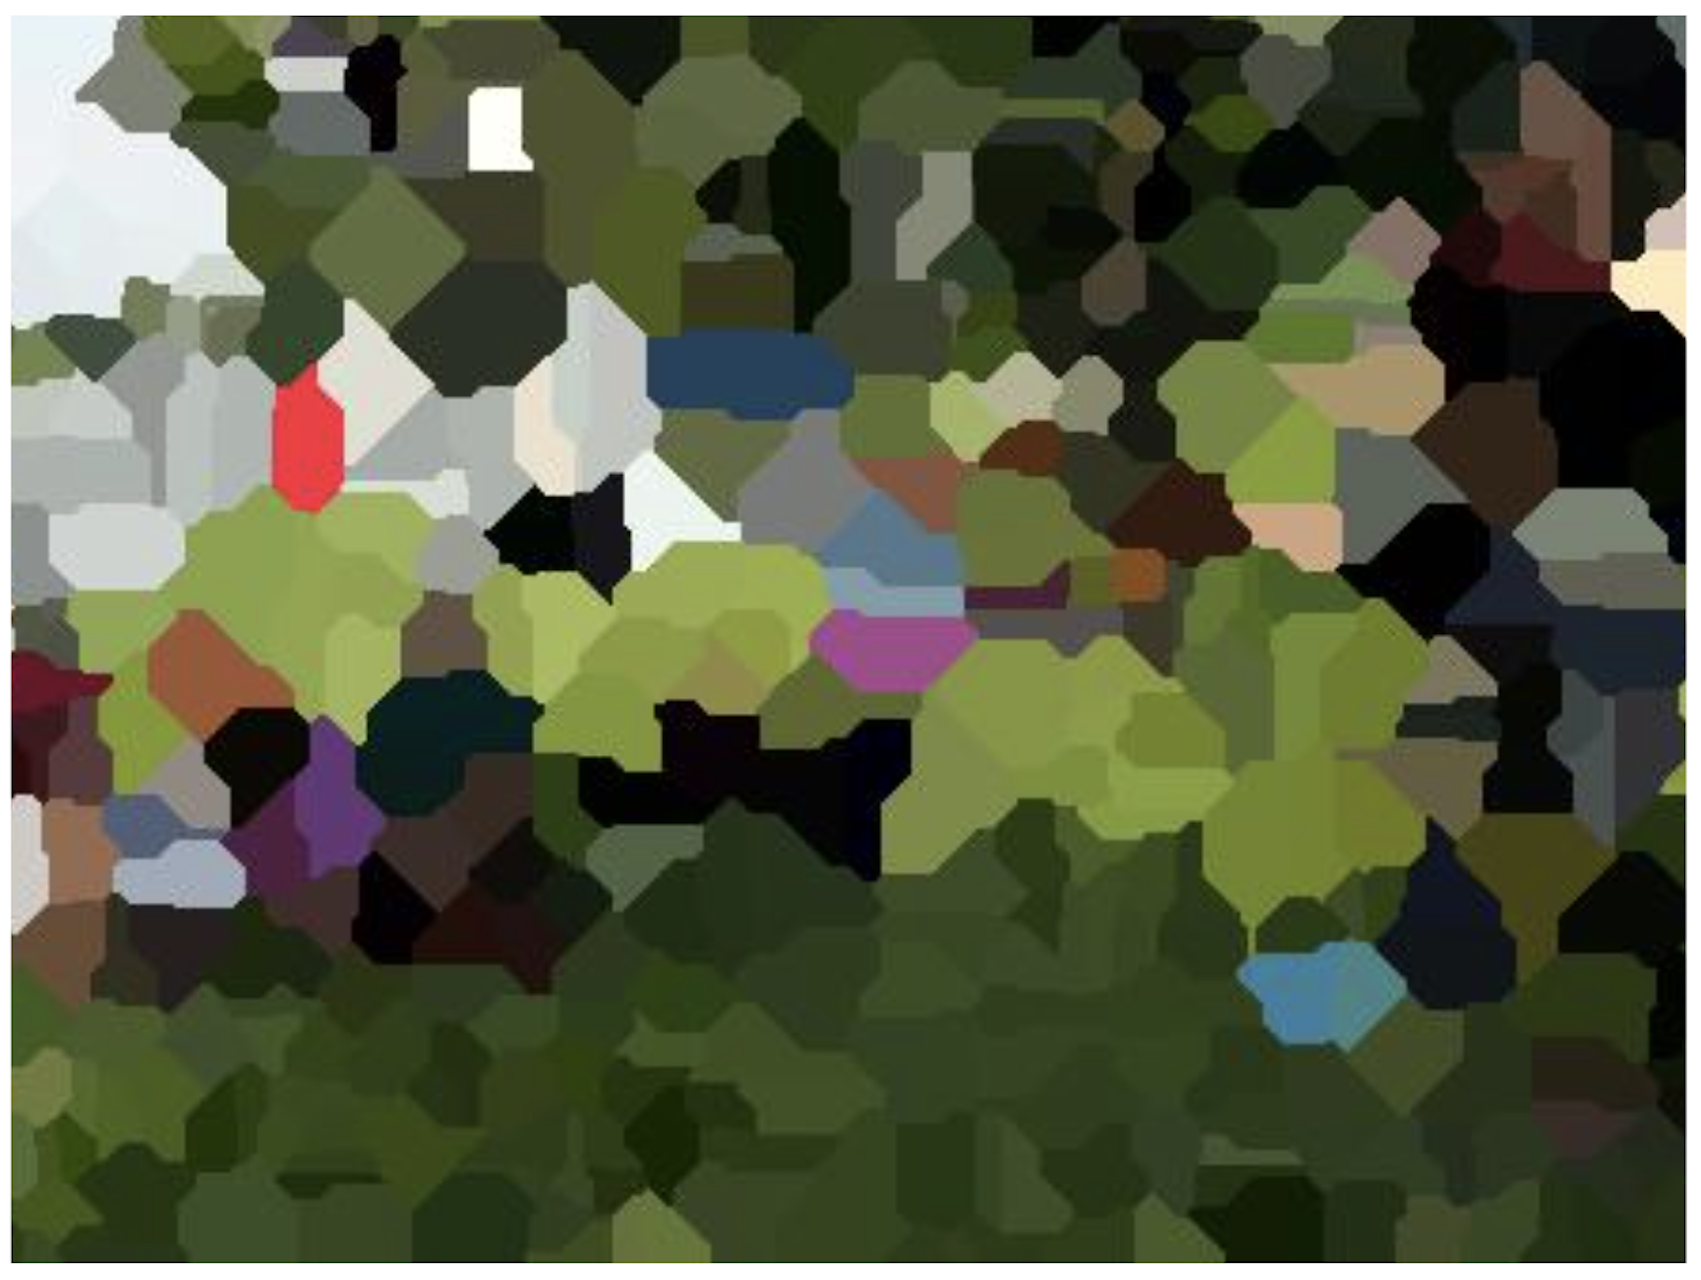
Voronoi Diagrams — a beautiful structure from math and science, and we used it to make art!
A simple iterative algorithm — for each pixel, check every center. It works… but it’s slow.
A new data structure: the Queue — implemented with Python’s deque, it lines up data for orderly, first-in-first-out processing.
A new algorithm: Flood Fill — start at every center simultaneously and grow outward. The queue keeps it all synchronized.
Algorithm analysis — the naive approach costs \(n \cdot n\) work. Flood fill? Just \(n\). That’s the difference between 10 billion operations and 1 million.
Graphs: A new model for representing images
A Graph is a collection of vertices, and edges between them. They’re used as a general model for many problems.
In our images every ____________ is a vertex, and every ____________ is an edge.
Our fast algorithm for Voronoi Art mirrors a classic algorithm on graphs called Breadth First Search.
Breadth First Search
Breadth-first search (BFS) is an algorithm for traversing or searching tree or graph data structures. It starts at the tree root (or some arbitrary node of a graph), and explores all of the neighbor nodes at the present depth prior to moving on to the nodes at the next depth level. (–Wikipedia)