Programming, problem solving, and algorithms
CPSC 203, 2025 W1
October 7, 2025
Announcements
Today
Warm Up
Exploring pandas:
- Filtering Data
- Making charts
- Asking harder questions
Warm Up
datetime: a Python library that simplifies date computation.
Objects we need
date— a calendar day (year-month-day)timedelta— a number of days you can add/subtract
Core calls
today=date.today(): today’s datetoday.weekday(): an integer 0..6 with Mon=0, … , Sun=6today - timedelta(days=k): the date k days earlier
Last Saturday
Let \(w =\) today.weekday() \(\in \{0,\dots,6\}\) and note Saturday \(= 5\).
offset: How many days to step back to reach Saturday.
- If today is Saturday (\(w=5\)): offset \(=0\)
- If today is Sunday (\(w=6\)): offset \(=1\)
- If today is Monday (\(w=0\)): offset \(=2\)
- …
\[ \texttt{offset} = (w - 5)\bmod 7 \]
\[ \texttt{lastSaturday} = \texttt{today} - \texttt{timedelta(days=offset)}. \]
Code
Data Frames
pandas and data frames
import pandas
pandas.read_csv('file.csv')
we can say
This function returns a dataframe containing the data from file.csv.
To give a name to that dataframe, we say:
CSV files
To implement: df = pd.read_csv('bill_week.csv')
bill_week.csv must have field names in row 1, and data beginning in row 2.
bill_week.csv
,week,title,artist,rank,last_week,peak_pos,weeks_on_chart
0,2019-09-21,Truth Hurts,Lizzo,1,1,1,19
1,2019-09-21,Senorita,Shawn Mendes & Camila Cabello,2,2,1,12
2,2019-09-21,Goodbyes,Post Malone Featuring Young Thug,3,10,3,10
3,2019-09-21,Circles,Post Malone,4,7,4,2
4,2019-09-21,Bad Guy,Billie Eilish,5,3,1,24
5,2019-09-21,Ran$om,Lil Tecca,6,4,4,15
6,2019-09-21,No Guidance,Chris Brown Featuring Drake,7,6,6,14
Selecting rows
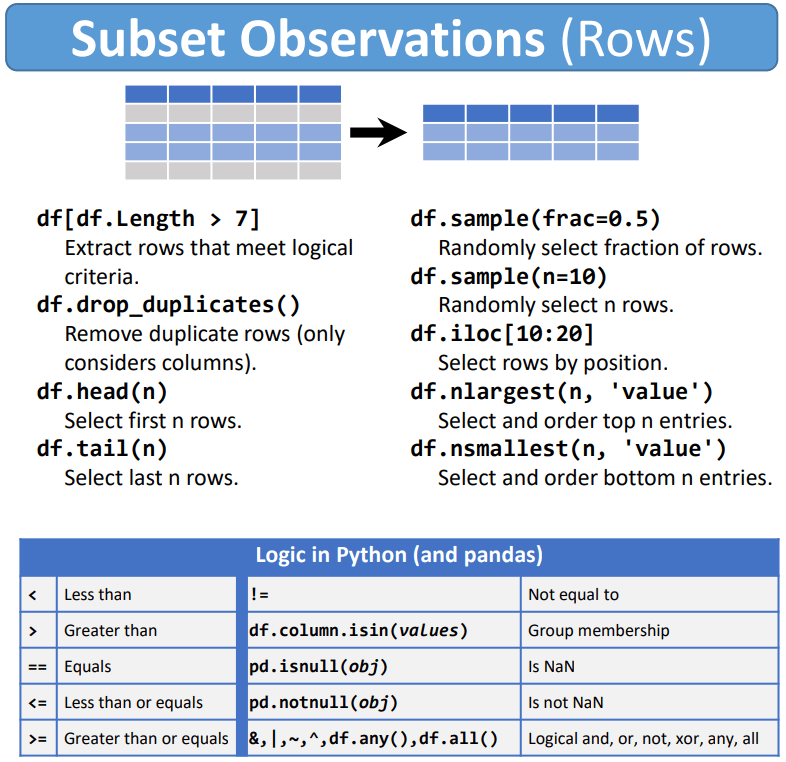
df.nlargest(10,'last_week')Returns top 10 hits from last week.
df[ df['weeks_on_chart'] > 10 ]Returns all songs that have been on the charts for more than 10 weeks.
Adding a column
df['gradient'] = df['last_week'] - df['rank']Adds a column to the DataFrame containing the difference for every row.
df[ df['gradient'] > 10 ]Returns all songs that have moved more than 10 spaces in the last week.
Some challenges…
Given last week’s chart:
How many new songs were there?
What’s the average peak?
Among those who were on the list for more than 10wk, what’s the average peak? (Is it very different than the previous answer?)
Which song changed the most? Was it rising or falling?
Write and answer your own question:
_____________________________________________________
Let’s Write Code
Open CA5.2 Billboard, and load class_nb.py.
Some challenges…
How many new songs are there?
| C | C | C | C | C | C |
|---|---|---|---|---|---|
| C | C | C | C | C | C |
| C | C | C | C | C | C |
| C | C | C | C | C | C |
| C | C | C | C | C | C |
| C | C | C | C | C | C |
| C | C | C | C | C | C |
| C | C | C | C | C | C |
| C | C | C | C | C | C |
| C | C | C | C | C | C |
Some challenges…
What’s the average peak?
| C | C | C | C | C | C |
|---|---|---|---|---|---|
| C | C | C | C | C | C |
| C | C | C | C | C | C |
| C | C | C | C | C | C |
| C | C | C | C | C | C |
| C | C | C | C | C | C |
| C | C | C | C | C | C |
| C | C | C | C | C | C |
| C | C | C | C | C | C |
| C | C | C | C | C | C |
Some challenges…
Among those who were on the list for more than 10wk, what’s the average peak? (Is it very different than the previous answer?)
| C | C | C | C | C | C |
|---|---|---|---|---|---|
| C | C | C | C | C | C |
| C | C | C | C | C | C |
| C | C | C | C | C | C |
| C | C | C | C | C | C |
| C | C | C | C | C | C |
| C | C | C | C | C | C |
| C | C | C | C | C | C |
| C | C | C | C | C | C |
| C | C | C | C | C | C |
Some challenges…
Which song moved the most? Did it rise or fall?
| C | C | C | C | C | C |
|---|---|---|---|---|---|
| C | C | C | C | C | C |
| C | C | C | C | C | C |
| C | C | C | C | C | C |
| C | C | C | C | C | C |
| C | C | C | C | C | C |
| C | C | C | C | C | C |
| C | C | C | C | C | C |
| C | C | C | C | C | C |
| C | C | C | C | C | C |
Resources
https://pymotw.com/2/datetime/
https://www.dataschool.io/best-python-pandas-resources/
https://pandas.pydata.org/Pandas_Cheat_Sheet.pdf
https://queirozf.com/entries/pandas-dataframe-plot-examples-with-matplotlib-pyplot